News Courtesy of Yoast.com:
Running a page speed test
Running a page speed test is as simple as inserting your website’s URL into a form on a website. That website then analyzes your website and comes up with recommendations. I’d like to mention two of those, but there are much more tests available.
- Pingdom provides a tool for speed testing. The nice thing is that you can test from different servers. For instance, from a server that is relatively close to you. Especially if you are targeting a local audience, this is a nice way to see how fast your website for them is.
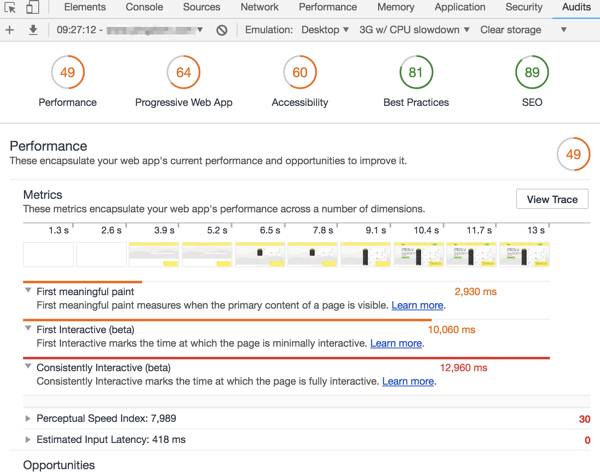
- Google Lighthouse is a performance tool that lives in your browser. Click right on a page, choose Inspect and check the Audits tab in the new window that opens in your browser. Here, you can test speed for mobile device or desktop, and on different bandwidths for example. The test result looks like this:
Small remark: most sites appear slower in Lighthouse. This is because Lighthouse emulates a number of devices, for instance, a slow mobile/3g connection. (see the second bar in the screenshot above). With mobile first, this is actually a good thing, right?
I would hope the very first thing that a web design company would do after finishing a site for a client is to run a speed test. It’s one thing to have an amazing looking site. It’s quite another to have that website load quickly and without any hiccups. As a designer, there has to be a balance between aesthetics, speed, and the needs of your client. Having a widget that affects loading time, for instance, should be taken into consideration. Is it necessary? Will it have value to your visitors?
Pingdom is a great tool for testing out a website’s performance. I’d put it 3rd on my list behind GTMetrix and Page Speed Insights. I really don’t like the new Lighthouse tool in Chrome. Probably because of the poor marks it constantly gives the websites I build. I think it calls for too many sacrifices to be made. The same can be said for Page Speed Insights. You can get two completely different scores on a responsive website for mobile and desktop viewports. It’s not uncommon for me to receive a Green (Good) score on the desktop version while the mobile gets a Red (Bad) Score. Even though they have the same issues listed. I think perhaps, because of content being penalized before the fold. It doesn’t make sense from real-world use, however.
This is why I favor GTMetrix as my optimization grading tool of choice. Render blocking resources weigh heavily on Page Speed and Lighthouse. However, if you choose to defer scripts and CSS, there is a high chance that there will be a nasty case of Flash-Of-Unstyled-Content. Or even breaking functionality all-together. It is one of the most frustrating marks to try and fix.
Harmless fixes like image optimization, gzip compression and leverage browser caching all have no downside. They aren’t difficult to implement at all but can result in a much higher score. Perhaps the most important metric to evaluate is page loading time. GTmetrix says the average page loading time is 7.2 seconds. If you can manage to get all of the pages to load under 5 seconds I would say you’re in pretty good shape.


